We’ll start looking into how you can start building your own first charts and dashboard with Buzzebees Analytics in this section.
Creating a new chart
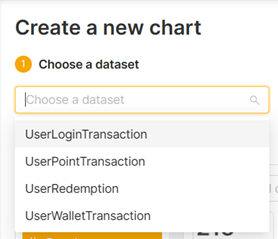
To create a new chart, you start by choosing a dataset that holds the type of data you’re looking to build a chart with. For example, if you want to plot the number of active users over a certain period, you need to pick UserLoginTransaction dataset. This is exactly what we’ll show you how to.
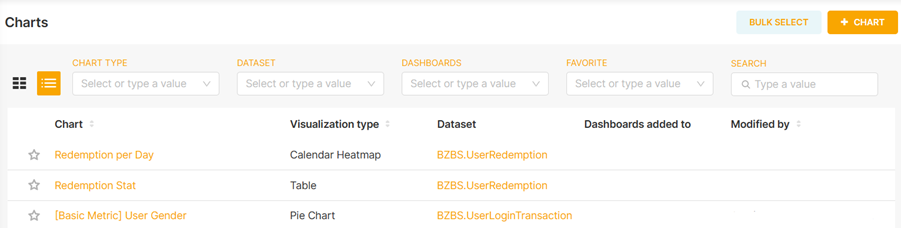
Step 1: On the chart page, click on + CHART button to create a new chart.
Step 2: On Create New Chart page, choose a dataset from the dropdown. In this case, select UserLoginTransaction.
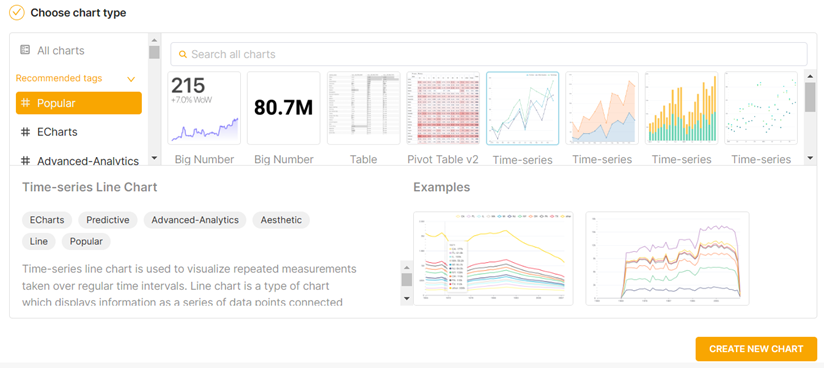
Step 3: Choose Time-series Line Chart and click CRETE NEW CHART button.
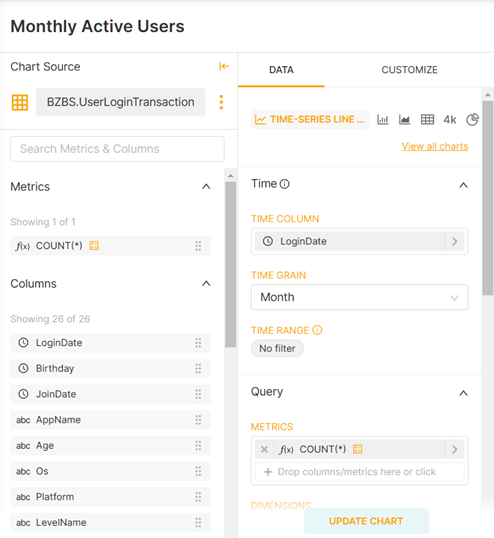
Step 4: Name the chart “Monthly Active Users”. Please note that the left-most panel lists all the available metrics and columns from the selected dataset. The middle panel shows you the Time and Query that you chose. Since we want active users per month, let’s drag LoginDate column into TIME COLUMN and change TIME GRAIN to “Month”. Since we want total active users on Y axis, drag f(x) COUNT(*) metric into METRICS and click UPDATE CHART button.
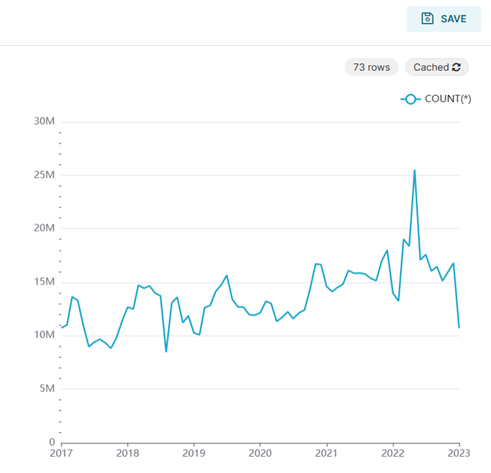
Step 5: In just a few seconds (depending on the amount of data. Sometimes, this could take a minute), you will see the active user chart appear on the right. Click SAVE button at the top right.
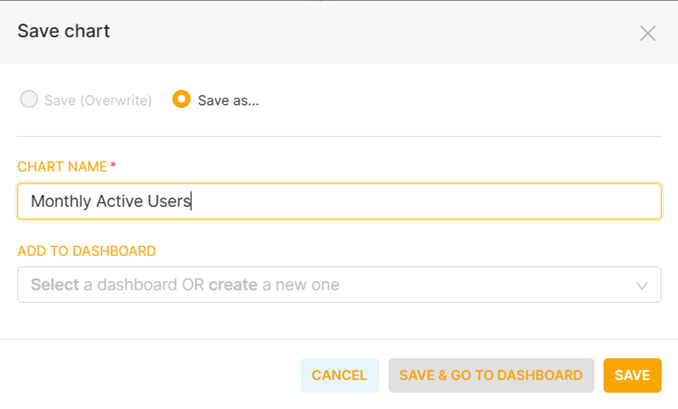
Step 6: The CHART NAME by default will be set to “Monthly Active Users” but you can change it here. Otherwise, just click SAVE button at the bottom.
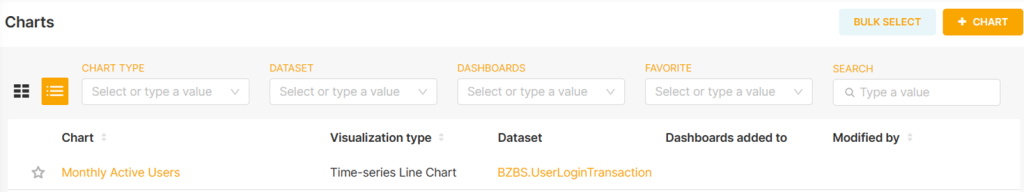
Step 7: Once you go back to Chart page, you’ll see the chart we’ve just created at the top of the list. Congratulations, you’ve just created your first chart.
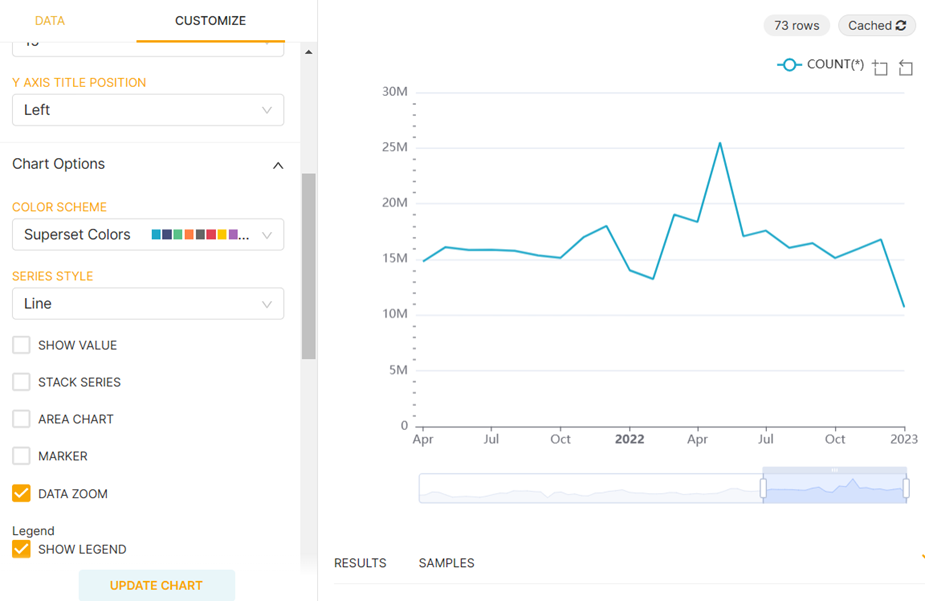
Step 8: You can customize the chart by clicking on the CUSTOMIZE tab. You’ll see there’re loads of options you can select to change the chart appearance. Let’s scroll down a bit and check DATA ZOOM. You’ll see that you can now zoom into a specific date range with the slider just below the chart.
Creating a new dashboard
Dashboard essentially is a set of charts put together so you can quickly see important metrics at a glance. Since you have already created one chart, you can add that chart along with other existing charts or charts that you plan to create in the future. Let’s walk through how you can create your first dashboard.
Step 1: On the Dashboard page, click on + DASHBOARD button to create a new dashboard.
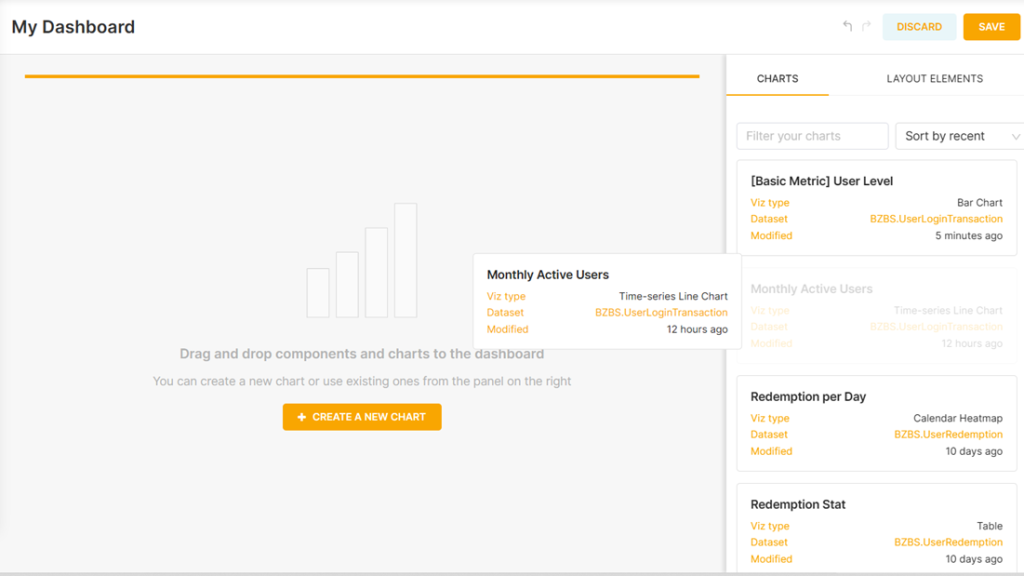
Step 2: Let’s change the title of the dashboard to “My Dashboard”. On the right, you can see a list of available charts that you can drag onto your new dashboard. Let’s use the Monthly Active Users chart that we just created earlier.
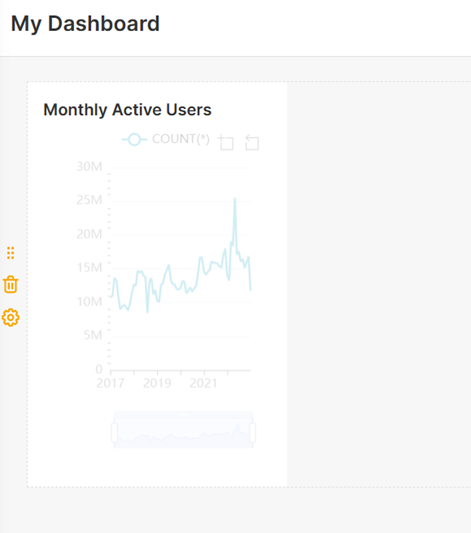
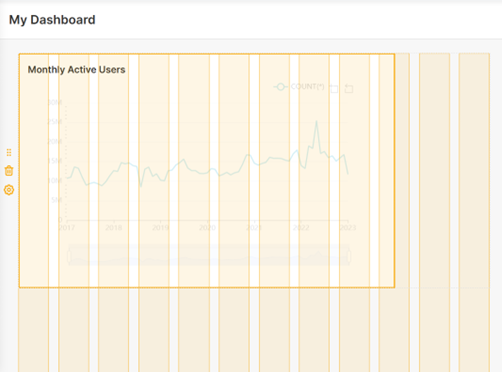
Step 3: You can drag the edge to increase the size.
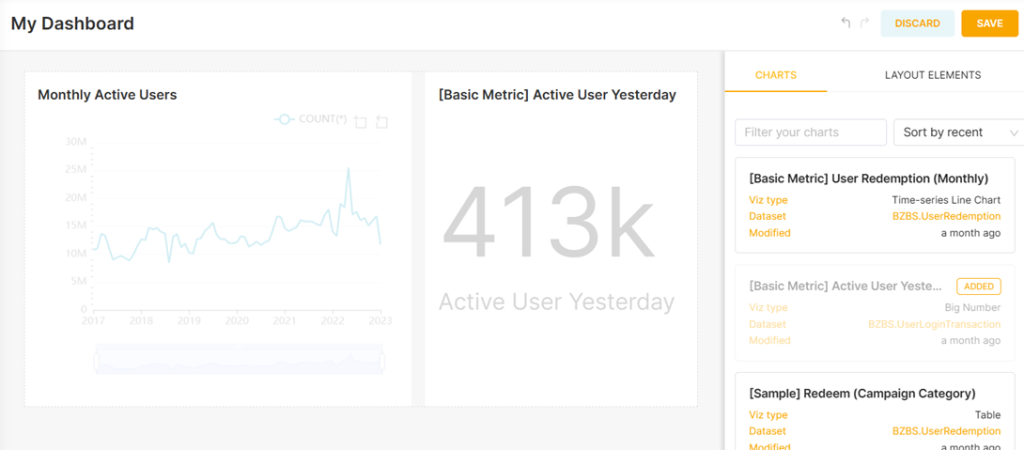
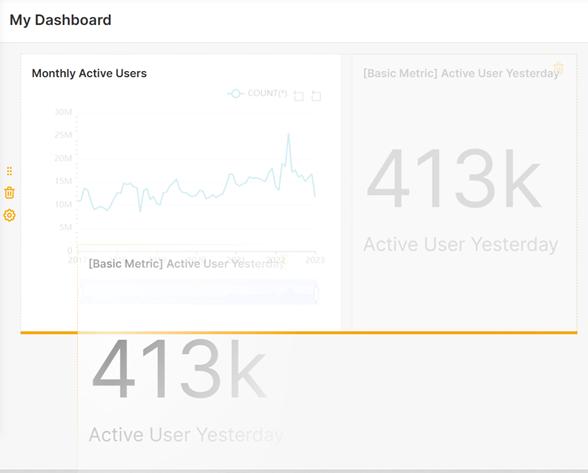
Step 4: Let’s add another existing chart into the dashboard right next to it.
Step 5: You can grab the whole chart down and place it just below the first one by drag and drop. You can remove unwanted chart away by clicking on the garbage can icon at the top right corner.
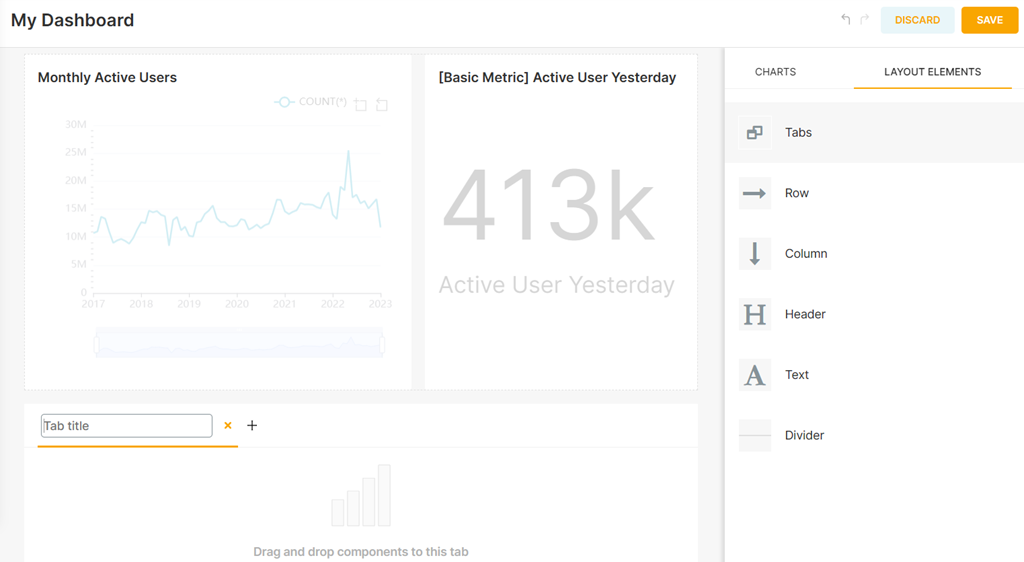
Step 6: You can add layout elements to adjust the appearance of the dashboard. For example, you can add Tab element to group a set of charts into separated tabs and also save space. There are other elements which you can explore yourself.
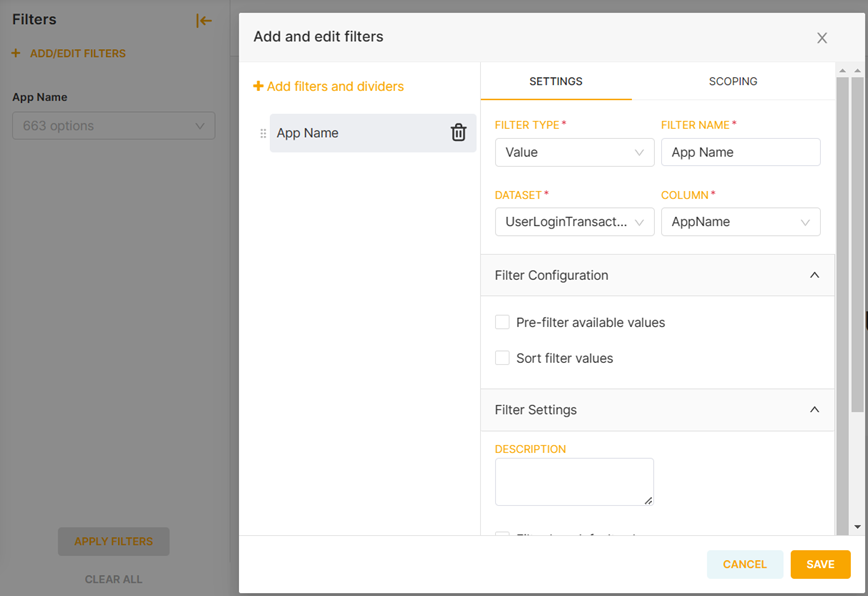
Step 7: You can also add filters which can be applied to all or specific charts on the dashboard. Click on the + ADD/EDIT FILTER and you’ll see a pop-up where you can adjust filter settings and configurations. Please note that you may not see the same set of data in each dataset depending on your permission. Once you’re done, hit the SAVE button so the new filter will appear on the filter panel on the left. Once you’re happy with the filters, just click APPLY FILTER button.
Step 8: Now you’ll see the filter appears on the filter panel. If you put the mouse cursor over the filter, it will show you the scope of the filter. In the example, the filter applies to all charts. You’ll also notice that the affected charts will also have glow borders.
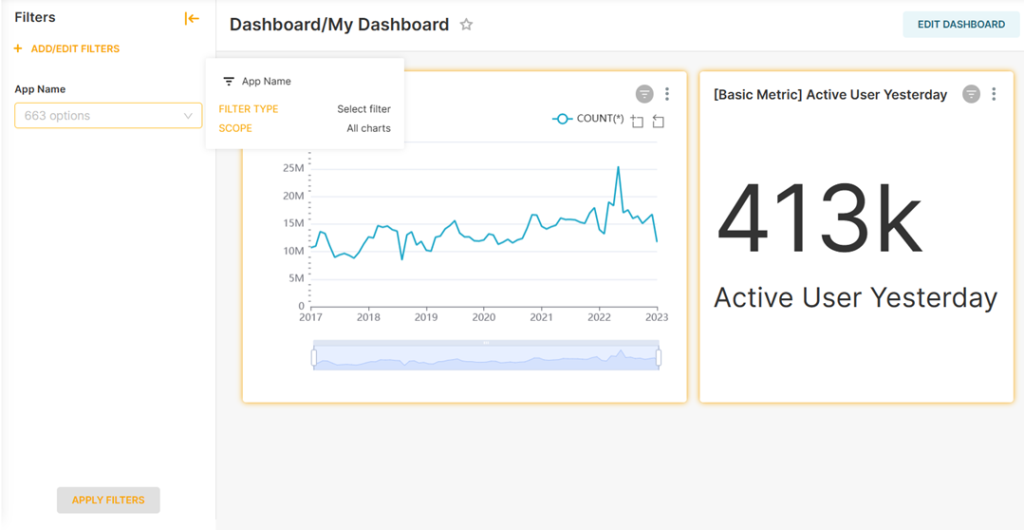
Step 9: Once you select a value from the filter, each affected chart should display data accordingly.
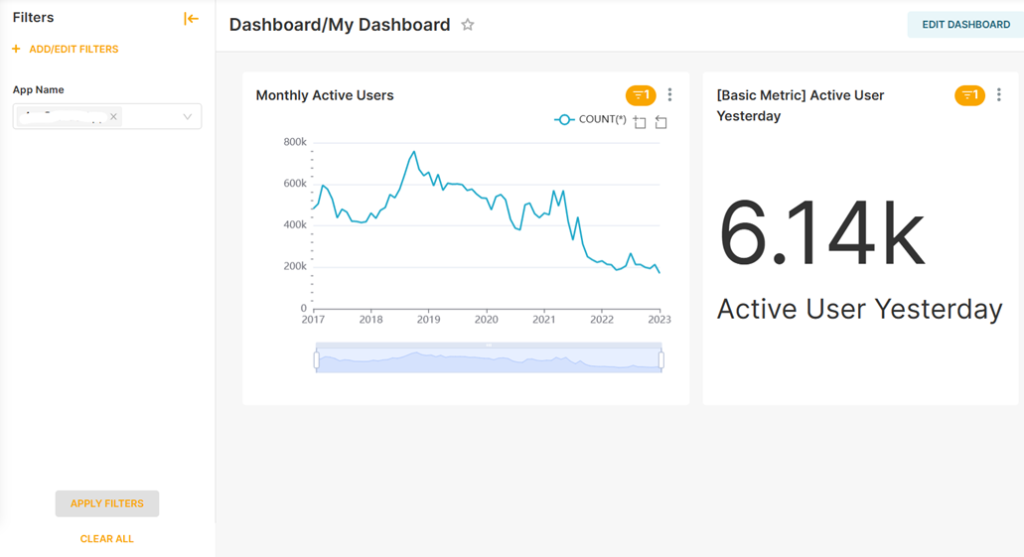
Congratulations! you've just created your first dashboard.